
Why AI Agents Fail in Production: Observability, Tracing, and Monitoring Explained
An AI agent can look impressive in a demo and still fail when real users depend on it.
It might call the wrong tool, repeat an action, lose track of a task, retrieve irrelevant information, or spend several minutes trying to recover from an error. Sometimes the final answer looks reasonable even though the agent took an incorrect path to produce it.
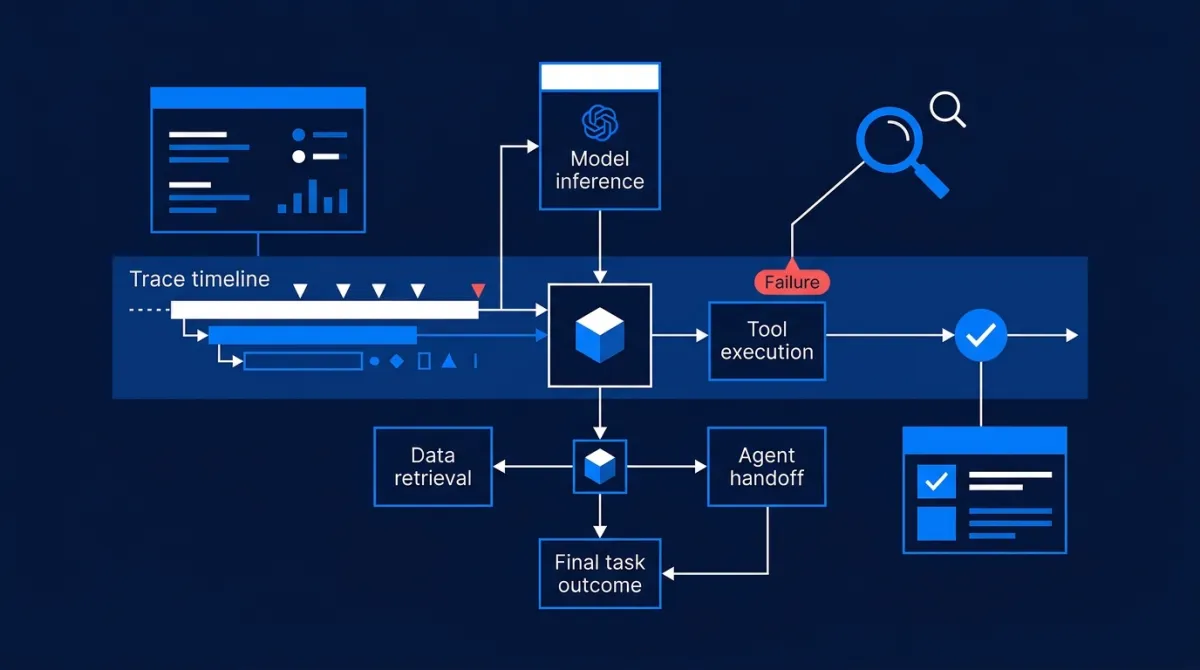
These failures are difficult to diagnose because an agent is not a single model call. It is a system of connected operations: model inference, tool execution, retrieval, memory access, state transitions, retries, and sometimes delegation to other agents.
A conventional application log might tell you that a request returned an error. It may not tell you why the agent chose a particular tool, which result it received, how many times it retried, or where the workflow went off track.
That is the operational challenge behind AI agent observability.
Production-ready agents need more than error logs. They need a way to reconstruct their execution, detect abnormal behavior, measure task quality, and connect failures to improvements.
1. Why agent failures are harder to debug
Consider a customer-support agent asked to check an order and update its delivery address.
A simplified execution might look like this:
- The model interprets the user's request.
- It calls an order lookup tool.
- The application retrieves the order details.
- The model decides that an address update is required.
- It calls an address validation tool.
- It calls an order update API.
- It reports the result to the user.
A failure can happen at almost every stage.
- Reasoning failure: The model misunderstands which order the user means.
- Tool-selection failure: It calls an unrelated tool or chooses the wrong operation.
- Integration failure: The external API times out or returns an unexpected response.
- State failure: The agent loses information between steps or uses stale data.
- Permission failure: The agent attempts an action it is not authorized to perform.
- Recovery failure: A retry repeats an operation that has already succeeded.
- Completion failure: The agent tells the user the address was updated even though the API rejected the change.
The important distinction is that an agent can fail without producing a conventional application error. It can complete every technical operation successfully and still perform the wrong task.
This makes traditional infrastructure monitoring necessary, but insufficient.
2. Observability, monitoring, and evaluation are not the same thing
These terms are often used interchangeably, but they answer different operational questions.
| Discipline | Main question | Example |
|---|---|---|
| Observability | What happened inside the system, and why? | Why did the agent call the wrong API? |
| Monitoring | Is the system behaving within expected limits? | Did the error rate or latency increase? |
| Evaluation | Did the agent perform the task correctly? | Was the delivery address actually updated? |
Observability: reconstructing behavior
Observability gives engineers access to the internal execution of an application through telemetry such as traces, logs, and metrics.
For an agent, this means being able to inspect the complete path from the initial user request to the final response.
You should be able to answer questions such as:
- Which model was called?
- Which tools were available?
- Which tool did the agent select?
- What arguments were passed?
- What did the tool return?
- Did the agent delegate work to another agent?
- How many model calls and retries occurred?
- Where did most of the execution time go?
Without this information, debugging becomes guesswork.
Monitoring: detecting operational problems
Monitoring turns selected signals into alerts and dashboards.
Examples include:
- A sudden increase in failed tool calls.
- Higher-than-normal response latency.
- Increased model token consumption.
- A growing number of incomplete tasks.
- A database or external API becoming unavailable.
Monitoring tells the team that something may be wrong. Observability helps investigate what happened.
Evaluation: measuring task quality
Evaluation asks whether the agent's behavior and final result meet defined expectations.
For example, a customer-support agent might be evaluated on:
- Whether it identified the correct order.
- Whether it used an approved tool.
- Whether it respected authorization rules.
- Whether it completed the requested action.
- Whether its final response accurately described the result.
A successful HTTP response is not proof of a successful agent task. Evaluation is what helps measure that difference.
The three disciplines work together: monitoring identifies suspicious behavior, observability exposes the execution path, and evaluation determines whether the behavior was acceptable.
3. Tracing: the foundation of agent observability
The most useful starting point for debugging complex agent workflows is distributed tracing.
A trace represents an end-to-end operation. It is composed of smaller units called spans, each representing an operation or part of an operation.
For an agent, a trace could contain:
- The overall agent run.
- Individual model generations.
- Tool calls and their results.
- Retrieval operations.
- Agent handoffs.
- Guardrail checks.
- Custom application operations.
A trace provides a timeline and a hierarchy of these operations.
What a trace might look like
Imagine the customer-support example again:
Trace: Update delivery address
│
├── Agent run
│   │
│   ├── Model call: Interpret request
│   │
│   ├── Tool: Get order
│   │   └── Result: Order found
│   │
│   ├── Model call: Decide next action
│   │
│   ├── Tool: Validate address
│   │   └── Result: Address valid
│   │
│   ├── Tool: Update order
│   │   └── Result: API timeout
│   │
│   ├── Retry: Update order
│   │   └── Result: Update successful
│   │
│   └── Model call: Generate final response
│
└── Final status: Completed
This trace immediately reveals something that a simple success log might hide: the order update required a retry.
It also raises an important question: did the first request fail before the external system applied the change, or did the update succeed but the response get lost?
That distinction matters. Blindly retrying a non-idempotent operation can create duplicate actions.
Traces and spans
A useful trace should preserve parent-child relationships.
The agent run is the parent operation. Model calls and tool executions are child operations. If one agent delegates work to another, the delegated operation should remain connected to the original trace where the instrumentation supports it.
This structure allows engineers to identify:
- The operation responsible for a failure.
- The slowest step in the workflow.
- Repeated calls to the same tool.
- Unexpected execution paths.
- Work performed by individual agents in a multi-agent system.
OpenTelemetry provides a common framework for collecting and exporting traces, metrics, and logs. Its semantic conventions define shared names and attributes so telemetry can be interpreted consistently across different tools and services.
For AI-specific instrumentation, the OpenTelemetry GenAI conventions also describe operations such as model inference, agent invocation, and tool execution. These conventions are still evolving, so teams should check their current stability status before treating every attribute as a finalized standard.
4. What should you instrument in an AI agent?
Capturing only the model request and final response leaves major gaps. Agent observability should cover the entire workflow.
Model calls
Record operational information such as:
- Model and provider.
- Request duration.
- Input and output token usage, when available.
- Response status.
- Error type.
- Retry count.
- Model configuration and relevant version identifiers.
This helps identify slow model calls, provider failures, and unexpected usage increases.
Tool executions
Tool calls are often where an agent interacts with systems that can change real-world data.
Record:
- Tool name and version.
- Execution start and end times.
- Call status.
- Error details.
- Retry attempts.
- A correlation identifier for the operation.
- The result status, where appropriate.
For sensitive operations, it is particularly important to distinguish between a tool being requested, a tool being executed, and an action being confirmed by the external system.
A model saying it updated an order is not equivalent to the order-management API confirming the update.
Retrieval and memory
If an agent uses retrieval-augmented generation (RAG) or persistent memory, instrument those operations too.
Useful signals include:
- Retrieval query.
- Data source or index identifier.
- Number of retrieved documents.
- Retrieval latency.
- Filtering decisions.
- Memory read and write operations.
- Whether the expected information was available.
This helps distinguish a reasoning problem from a context problem. An agent may generate a poor answer because the model misunderstood the evidence—or because the retrieval system never supplied the right evidence in the first place.
Agent state and workflow transitions
For stateful or multi-agent systems, record important transitions:
- Current workflow stage.
- Agent or sub-agent responsible for the step.
- Handoff events.
- Approval status.
- Retry and recovery decisions.
- Final completion status.
You do not necessarily need to store every internal state value. Focus on the transitions that help explain the workflow and diagnose failures.
Application-level outcomes
Finally, connect agent execution to the actual business operation.
Examples:
- Was the ticket created?
- Was the payment confirmed?
- Was the report generated?
- Was the requested record updated?
- Did a human approve the action?
This is the layer that connects technical execution to meaningful task completion.
5. The production metrics that matter
Collecting telemetry is only useful if the team knows what to measure.
A dashboard with dozens of graphs can create the illusion of control without answering whether the agent is reliable.
Start with a small set of metrics organized around four dimensions.
Reliability
| Metric | What it reveals |
|---|---|
| Task completion rate | How often the agent reaches a defined successful outcome |
| Tool error rate | How often tool executions fail |
| Incomplete-run rate | How often workflows stop without a valid completion |
| Retry rate | How frequently the system needs to repeat operations |
| Escalation rate | How often tasks require human intervention |
Define success carefully. A task should count as completed only when the required outcome is confirmed, not simply when the model returns a final message.
Latency
Track both end-to-end duration and the duration of individual operations.
Useful measurements include:
- Total task latency.
- Model-call latency.
- Tool-execution latency.
- Retrieval latency.
- Time spent waiting for external services.
Use percentiles such as p50, p95, and p99 rather than relying only on average latency. An average can conceal a small but important group of extremely slow requests.
Cost and resource usage
Track:
- Input and output tokens.
- Cost per completed task.
- Cost per workflow or agent.
- Number of model calls per task.
- Tool calls per task.
- Retry-related consumption.
The number of model calls is particularly useful. A workflow that normally requires three calls but suddenly requires twelve may have entered a loop or started handling requests inefficiently.
Cost should be measured against successful outcomes. A cheap run that does not complete the task is not necessarily efficient.
Quality and safety
Operational metrics do not measure everything that matters.
Add quality signals such as:
- Task correctness.
- Tool-selection accuracy.
- Policy compliance.
- Groundedness of answers.
- Human-review outcomes.
- Rate of unauthorized or blocked actions.
These metrics usually require evaluation logic, structured business outcomes, or human review rather than infrastructure monitoring alone.
6. Why successful tool calls can still produce failed agents
One of the most misleading production signals is a high tool success rate.
Suppose an agent receives a request to cancel a subscription. It calls a customer lookup API successfully, retrieves the correct customer, and calls the subscription API successfully.
Technically, both tools worked.
But what if the agent selected the wrong subscription because the customer had several active subscriptions? Or what if the user only asked about cancellation and never authorized it?
The infrastructure may report successful requests while the agent has made a serious operational mistake.
This is why agent evaluation should examine the workflow, not just its individual components.
A practical evaluation system can combine three approaches:
1. Deterministic checks
Use code to verify facts that can be checked objectively:
- Was the correct record updated?
- Did the operation return the expected status?
- Was the required approval present?
- Did the agent respect access permissions?
2. Model-based evaluation
Use an evaluator model to assess less deterministic qualities, such as whether a response follows instructions or is supported by the available context.
Model-based evaluators need validation too. They can be inconsistent or miss domain-specific errors, so they should not be treated as an unquestionable source of truth.
3. Human review
For high-impact workflows, human reviewers can inspect sampled traces, judge ambiguous cases, and identify failure categories that automated checks miss.
Human feedback can then become test cases for future evaluations.
The strongest approach combines these methods rather than expecting a single score to represent agent quality.
7. From production traces to a continuous improvement loop
Observability should not end when an engineer finds a failed request.
The goal is to turn production evidence into a better agent.
A practical improvement loop looks like this:
- Capture: Collect traces from real production runs.
- Detect: Use monitoring and evaluation to identify abnormal or low-quality behavior.
- Investigate: Inspect traces to locate the failing model call, tool, retrieval step, or transition.
- Classify: Group the failure into a meaningful category.
- Create a test: Turn the failed scenario into a reproducible evaluation case.
- Improve: Change the prompt, tool definition, retrieval logic, workflow, model, or application code.
- Validate: Run the evaluation suite against the new version.
- Release and monitor: Deploy the change and check whether the failure rate improves in production.
This is more reliable than repeatedly editing prompts based on a few memorable examples.
For instance, if production traces reveal that an agent frequently selects the wrong customer record, the team should not immediately assume the prompt is the problem. The root cause could be ambiguous tool descriptions, insufficient customer identifiers, missing application validation, or poor retrieval results.
The trace helps locate the problem. The evaluation dataset helps prevent it from returning.
8. The observability tools and ecosystem
There is no single observability platform that every agent team must use. The right choice depends on the framework, infrastructure, data policies, and the level of control the team needs.
Here are several relevant options.
OpenTelemetry
Best for: Teams that want vendor-neutral instrumentation and control over their telemetry pipeline.
OpenTelemetry provides APIs, SDKs, and conventions for collecting traces, metrics, and logs. It is particularly useful when agent workflows combine multiple frameworks, model providers, databases, and external services.
It is an instrumentation and telemetry foundation, not a complete agent evaluation product.
Official resource: OpenTelemetry documentation
OpenAI Agents SDK tracing
Best for: Teams building with the OpenAI Agents SDK.
The SDK includes tracing for agent runs, model generations, tool calls, handoffs, guardrails, and custom spans. Engineers can inspect execution in the Traces dashboard and, in supported configurations, export trace data in OTLP format.
This provides a convenient starting point for debugging agent workflows without building every trace manually.
Official resources:
LangSmith
Best for: Teams that want tracing, monitoring, and evaluation workflows for agent applications.
LangSmith supports tracing across agent frameworks and offers tools for inspecting model calls, tool behavior, latency, and feedback. It also connects production traces with evaluation and improvement workflows.
Official resource: LangSmith observability
Arize Phoenix
Best for: Teams looking for an open-source observability and evaluation platform.
Phoenix supports tracing through OpenTelemetry and OpenInference integrations. It provides tools for inspecting LLM and agent execution, running evaluations, organizing datasets, and investigating application behavior.
Its open-source approach can be attractive to teams that want more control over where their observability infrastructure runs.
Official resource: Arize Phoenix documentation
Google Cloud Agent Observability
Best for: Teams operating agents in Google Cloud environments.
Google Cloud's agent observability guidance combines logs, metrics, and traces to help teams debug failures, monitor costs, and analyze agent behavior. Its documentation also describes using OpenTelemetry GenAI conventions to derive application-specific monitoring metrics from trace data.
Official resource: Google Cloud Agent Observability
A practical comparison
| Tool | Main role | Useful when |
|---|---|---|
| OpenTelemetry | Instrumentation standard and telemetry foundation | You need vendor-neutral telemetry |
| OpenAI Agents SDK tracing | Framework-native tracing | You use the OpenAI Agents SDK |
| LangSmith | Agent tracing, monitoring, and evaluation | You want an integrated agent-development workflow |
| Arize Phoenix | Open-source observability and evaluation | You want self-hosting and inspection capabilities |
| Google Cloud Observability | Cloud-native agent monitoring | Your infrastructure runs on Google Cloud |
These options are not all direct substitutes. OpenTelemetry can feed data into an observability backend, while framework-native tracing and platforms such as LangSmith or Phoenix provide additional inspection and evaluation capabilities.
9. Privacy and security: do not log everything
Agent traces can contain more sensitive information than ordinary infrastructure logs.
They may include:
- User messages.
- System instructions.
- Retrieved documents.
- Tool arguments.
- API responses.
- Personal or financial information.
- Internal business records.
Capturing full prompts and tool payloads can make debugging easier, but it also increases the amount of sensitive information stored in telemetry systems.
A safer approach is to design data capture deliberately.
Use data minimization. Record the operational fields needed to debug the system. Do not automatically store complete prompts and responses unless there is a justified use case.
Redact sensitive fields. Remove credentials, tokens, personal identifiers, and confidential data before exporting telemetry.
Control access. Apply role-based access, retention limits, and appropriate protections to trace storage.
Separate operational metadata from content. A tool's name, execution time, status, and error type may be enough for many monitoring tasks. Full arguments and results can be stored separately under stricter access controls when needed.
Be careful with sampling. Sampling can reduce telemetry volume, but rare failures may disappear from the dataset. Consider retaining all errors and high-risk operations while sampling routine successful traffic.
OpenTelemetry's GenAI conventions explicitly warn that model instructions, inputs, outputs, and tool payloads can contain sensitive information. They recommend that instrumentation not capture such content by default and provide opt-in approaches.
Reference: OpenTelemetry GenAI span conventions
10. A practical implementation roadmap
Teams do not need a sophisticated observability platform on day one. They need enough instrumentation to understand the system and a clear path to improve it.
A sensible rollout can happen in stages.
Stage 1: Make every run identifiable
Start with a correlation ID for each user request or agent task.
Record:
- Run ID.
- Timestamp.
- Agent and workflow version.
- Model and provider.
- Final status.
- Total duration.
This creates a common reference across application logs and agent execution.
Stage 2: Trace model and tool operations
Add spans for:
- Model calls.
- Tool executions.
- Retrieval operations.
- Agent handoffs.
- Important workflow transitions.
Make sure errors and retries are recorded as part of the execution history.
Stage 3: Build operational dashboards
Start with a few high-value metrics:
- Task completion rate.
- p95 task latency.
- Tool failure rate.
- Retry rate.
- Cost per completed task.
Set alerts around meaningful changes, not every small fluctuation.
Stage 4: Introduce evaluations
Build a small test dataset from real user requests and known failure cases.
Use deterministic checks wherever possible, model-based evaluation where appropriate, and human review for ambiguous or high-impact cases.
Run the tests whenever prompts, tools, models, or workflow logic change.
Stage 5: Connect monitoring to improvement
Review recurring failure patterns. Prioritize problems by impact and frequency, then convert them into regression tests.
This is where observability becomes part of the engineering lifecycle rather than a dashboard that nobody checks.
Conclusion: reliable agents need evidence, not just convincing answers
The move from AI demos to production agents changes the engineering problem.
A model can generate a convincing answer, but production software must do more: execute the right operations, respect permissions, recover from failures, control resource consumption, and produce verifiable outcomes.
That requires three complementary capabilities:
- Observability to reconstruct what happened.
- Monitoring to detect when the system behaves abnormally.
- Evaluation to determine whether the agent actually did the right thing.
Tracing is the foundation because it exposes the execution path across model calls, tools, retrieval, and agent handoffs. But traces alone do not establish correctness. Teams must connect them to business outcomes, evaluation datasets, and controlled production metrics.
The most mature agent systems will not simply collect more telemetry. They will use production evidence to continuously identify failure patterns, improve workflows, and verify that each change makes the system more reliable.
An agent is not production-ready because it can complete a task once. It is production-ready when its behavior can be understood, measured, tested, and improved.